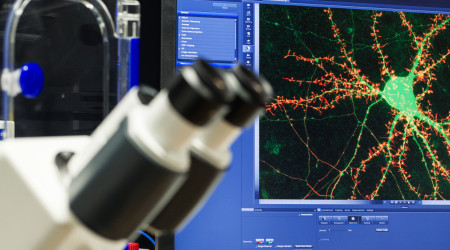
Myelin, the insulating sheath around nerve fibres, is essential for fast, healthy signalling in the brain, and its patterns enormously vary across brain tissue regions. Researchers at the University of Eastern Finland have developed a computer method that can quantify these patterns automatically, without any manual labelling of tissue images. The findings were published in Brain Structure and Function.
The challenge of measuring myelin patterns
Turning what is visible under a microscope into something you can measure and compare has long been a challenge. Researchers have traditionally done this by staining tissue sections, then analysing them by eye, region by region, or through quantitative measures such as staining intensity, approaches that do not capture the true complexity of myelin patterns.
“Myelin covers most axons in the brain and altogether forms such a variety of patterns. Some brain areas are densely packed with aligned myelinated axons such as the corpus callosum and optic nerve. Others, like the cortex, vary in density and orientation, from axons running in a clear direction to net-like patterns, with every intermediate case in between. We needed a way to quantify those patterns properly, not just describe them by eye, or reduce them to basic measures like staining intensity,” says Doctoral Researcher Melina Estela of the A. I. Virtanen Institute for Molecular Sciences at the University of Eastern Finland.
From patterns to numbers
The new method works by dividing each tissue image into small windows, and using a technique called a convolutional autoencoder to compress the information in each window into a small set of numbers. Windows with similar numbers are then grouped together, producing unsupervised maps that automatically separate tissue into regions with distinct properties, from broad divisions between white and grey matter down to finer structures such as the hippocampal subfields and cortical layers.
Spotting injury without being told what to look for
The researchers trained the method on tissue images from both healthy and injured animals, then looked at how the resulting quantification differed between the two groups. One map, corresponding to major white matter tracts, was reduced in injured animals, directly reflecting axonal damage. Other maps also differed in proportion between healthy and injured tissue, pointing to additional, subtler changes that will need further study to interpret.
Why this matters
Because the method needs no manual labelling, it could make large-scale studies of brain tissue faster and more consistent. The approach could extend beyond myelin to other stains, tissue types and diseases.
The work was funded by the European Union's Horizon 2020 research and innovation programme under the Marie Skłodowska Curie agreement No 101034307, and by the FAME Flagship of the Research Council of Finland.
For further information, please contact:
Melina Estela, A. I. Virtanen Institute for Molecular Sciences, University of Eastern Finland, [email protected]
Alejandra Sierra, A. I. Virtanen Institute for Molecular Sciences, University of Eastern Finland, [email protected]
Research article:
Melina Estela, Raimo A. Salo, Isabel San Martín Molina, Omar Narvaez, Ville Kolehmainen, Jussi Tohka, Alejandra Sierra. Autoencoders for unsupervised analysis of rat myeloarchitecture. Brain Struct Funct 231, 141 (2026). https://doi.org/10.1007/s00429-026-03166-w